Why does the average home cost 7.6 times your salary?
In 1997 the average home in England cost three and a half times a full-time salary. Today it costs 7.6 times. The house did not change. The thing we measure it in did.

Jordan Walker

The house has not changed. Same bricks, same street, same three bedrooms, same view of next door's bins. What changed is the number of pounds it takes to buy it.
In 1997, the average home in England sold for about three and a half times what a full-time worker earned in a year. In 2025 it sold for 7.6 times. That is the Office for National Statistics figure, published in March 2026: a median home at £300,000, against median full-time earnings of £39,300.
Nobody added an extra floor in the meantime. So where did the other four years of your working life go?
The short answer
Houses are bought with borrowed money, and the amount people can borrow has grown much faster than the amount they earn.
Sellers price to what buyers can raise. When credit gets cheaper, or the repayment term gets longer, buyers can raise more. The asking price moves up to meet them. The house is unchanged, but the number attached to it is bigger.
The part most people never hear is where that borrowed money comes from. It is not scooped out of some other saver's account. Banks create it in the act of lending.
The gap, in numbers
The ONS has run this series since 1997, and the trend is not subtle.
Between 1997 and 2016, the median price paid for a home in England and Wales rose by 259%. Median individual earnings rose by 68%.
The ONS treats five years of earnings as a rough marker of affordability. In 1997, 88% of local authority areas in England and Wales came in under that line. By 2025 only 23 areas did, which is 7% of them.
The spread across the country is enormous. In the North East, the average home costs 5.0 times average earnings. In London it is 10.6. In Kensington and Chelsea it is 25.2. The two most affordable places in England and Wales are Hyndburn in Lancashire and Kingston upon Hull, both at 4.1.
There is genuine good news in the latest data. Affordability has improved every year since the 2021 peak, because wages have finally moved faster than prices. Since 2021, median earnings across England and Wales are up 25% while median house prices are up 5%. The 2025 ratio of 7.6 is the lowest since 2015.
That still leaves the average home costing more than seven years of gross pay, against three and a half in 1997.
It is not mainly about bricks
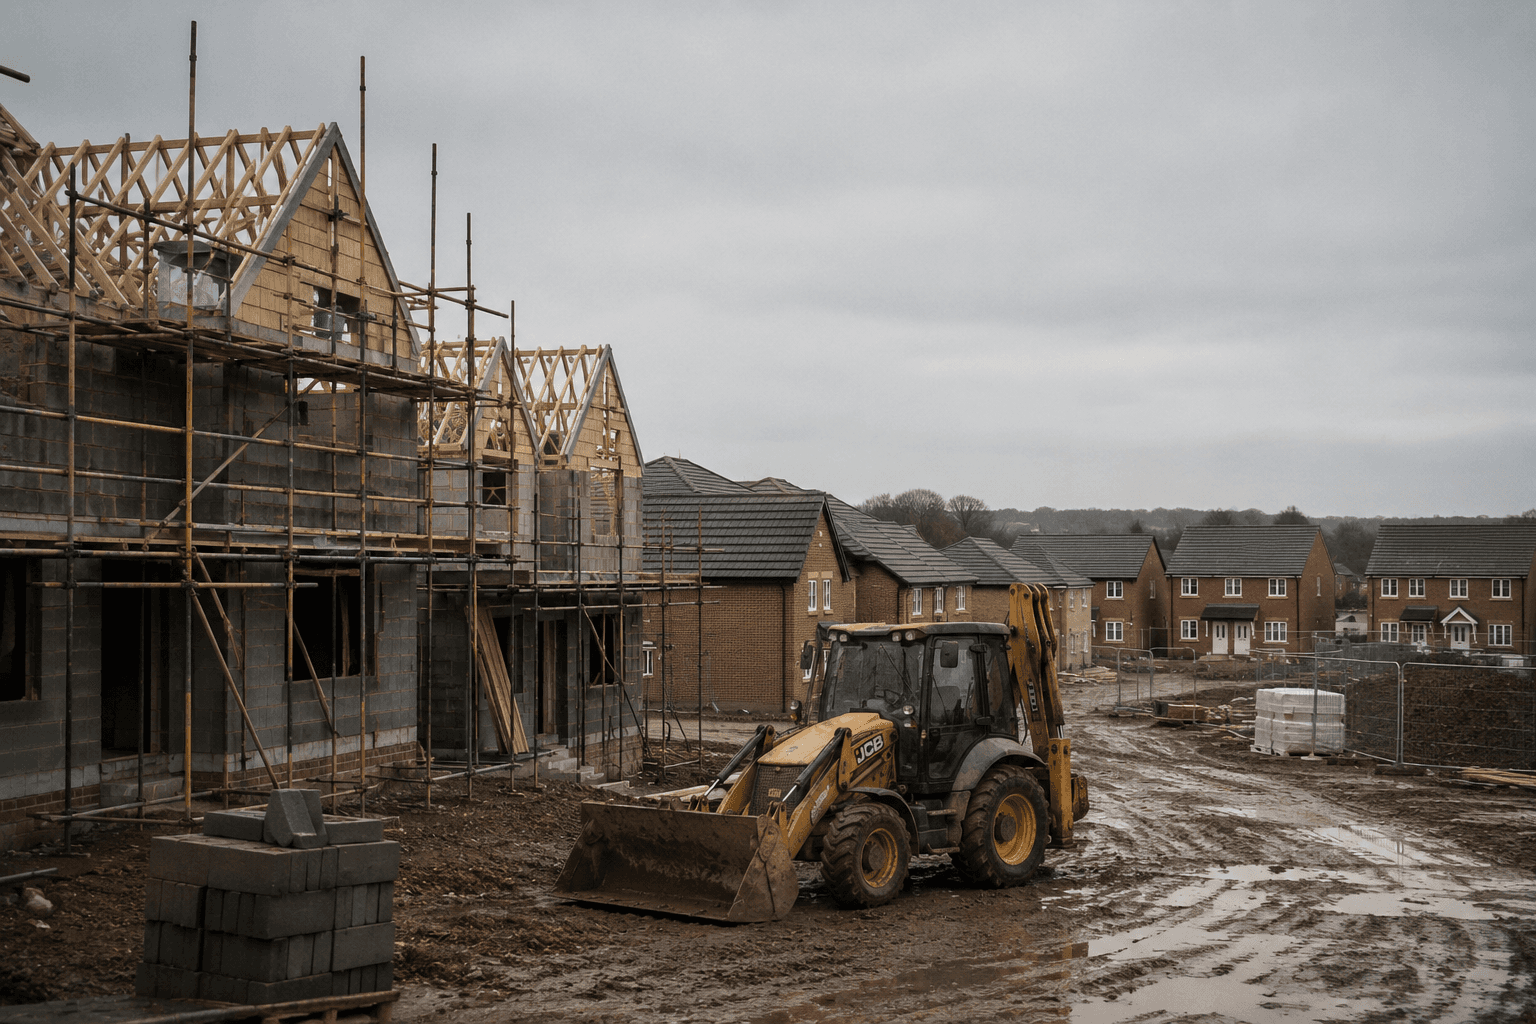
The usual explanation is that Britain does not build enough houses. Supply does matter, and nobody sensible pretends otherwise. But it is not the whole story, and the numbers make that awkward.
England added 208,600 net new dwellings in 2024-25, according to the Ministry of Housing, Communities and Local Government, against around 156,000 in 1997-98. Building is up on where it was when the average home cost 3.5 years of pay, and the ratio doubled anyway.
New homes barely touch the market in any case. In the year to September 2025 they made up just 5.6% of sales in England and 3.2% in Wales, so when you buy a house in Britain you are almost always buying a second-hand one.
Households have grown over the same period, and building has not kept pace with that. Even so, a supply story on its own cannot explain a doubling. Something else did most of the work.
Where the money actually comes from
In March 2014, the Bank of England published a paper in its Quarterly Bulletin called "Money creation in the modern economy." It is worth reading because it quietly demolishes what most of us were taught.
Banks do not lend out deposits that savers placed with them. When a bank approves a mortgage, it types a new deposit into the borrower's account, and the loan and the deposit are created in the same moment. New money enters the economy at the point the mortgage completes.
The scale of it is easy to miss. As of the first quarter of 2026, UK residential mortgage lending outstanding stood at £1,746 billion, according to the Bank of England and FCA's joint mortgage statistics, and the Bank's broad money measure, M4, was about £3.2 trillion at the end of 2025. Mortgage debt is one of the largest single blocks of money in the British economy.
So housing does not simply compete for a fixed pool of existing pounds. The act of buying a house creates new ones.
Why cheaper credit means dearer houses
Most buyers do not think in house prices at all. They think in monthly payments, in what lands in the account and what leaves it.
Take a household that can comfortably manage £1,000 a month on a standard 25-year repayment mortgage. At a 6% interest rate that supports a loan of roughly £155,000. At 2%, the same £1,000 a month stretches to roughly £236,000. Nothing about the household has changed, and their budget has not moved an inch, yet their borrowing power has jumped by more than £80,000.
Bank Rate sat at 0.1% from March 2020 to December 2021, the lowest in the Bank of England's 330-year history. It is 3.75% today, held there at the June 2026 meeting. Cheap money was withdrawn, which is exactly why affordability has been improving since 2021.
The other lever is time. Stretching that same £1,000 a month from 25 years to 35 years at 5% lifts the loan from about £171,000 to about £198,000. It is a real strategy, and buyers are using it. Bank of England analysis found the share of new mortgages taken over 30 years or more rose from 12% in late 2005 to 50% by early 2024. The English Housing Survey put 62% of recent first-time buyers on terms of 30 years or more in 2024-25, up from 47% five years earlier.
The average age of a new homeowner in England is now 34, so a 35-year term taken from there runs on until they are 69.
None of this makes anyone better off. It simply lifts the price until the monthly payment hurts just as much as it did before.
What this has to do with Bitcoin
Here is the uncomfortable thought at the end of all this. If the house is unchanged and the price has doubled, then the thing that moved might not be the house at all. It might be the ruler we measure it with.
The pound is a measuring stick that can be lengthened, not by conspiracy but by ordinary mechanics: banks lending, rates falling, terms stretching, new money being created. Anything scarce and desirable that people borrow to buy gets caught in that updraught, and housing gets caught worst of all, because it is the thing Britain borrows most heavily against.
Bitcoin was built with the opposite property. The supply is capped at 21 million, the issuance schedule is fixed in the software, and no bank can lend more of it into existence. Whether it holds its value in any given year is a separate question, and the swings are large. But the quantity cannot be quietly expanded while you are not looking.
Which is why measuring a house in Bitcoin rather than pounds gives such a different picture. Our Bitcoin vs UK house prices tool tracks it: the average UK home was £271,000 in May 2026, which at the time of writing is somewhere around five and a half Bitcoin. That number has fallen a great deal over the past decade, and it has had violent years along the way. You can see the same idea from the other direction with our purchasing power of the pound tool, which shows what a pound saved in 1997 buys today.
This is education, not financial advice. Bitcoin is volatile and you can lose money. But if you have ever wondered why the ladder keeps moving while you climb, the answer is less about bricks than about the thing we count them in.
New to all this? Start with WTF is Bitcoin, our plain-English guide. Or get one email a week, no hype, with the newsletter.
Frequently asked questions
What is the house price to earnings ratio in the UK? In 2025 the median home in England cost 7.6 times median full-time earnings, and in Wales 6.0 times, per the ONS. The ONS series covers England and Wales only. Average prices in May 2026 were £292,000 in England, £215,000 in Wales, £196,000 in Scotland and £198,000 in Northern Ireland.
Why are UK houses so expensive? Prices have risen far faster than wages since 1997. Cheaper credit, longer mortgage terms and the creation of new money through bank lending have all raised what buyers can borrow, and prices have followed. Restricted supply adds to it, particularly in London and the South East.
Are UK houses more affordable than they were in 2021? Yes, modestly. Affordability has improved every year since the 2021 peak. Since then median earnings across England and Wales are up 25% while median house prices are up 5%. The 2025 ratio of 7.6 is the lowest since 2015, but still well above the 3.5 of 1997.
Where do banks get the money for mortgages? They create it. The Bank of England set this out in 2014: when a bank makes a loan, it creates a matching deposit in the borrower's account, and new money enters the economy at that moment.
Does building more houses bring prices down? It helps, but it is not a complete answer. England built more homes in 2024-25 than in 1997-98, and the affordability ratio still doubled over that period. New builds are only 5.6% of sales in England, so most of the market is existing stock being repriced.
About

Featured Posts


Explore Topics


Related Post
Britain switched off its prison currency in 2018. Within months, inmates had reinvented money from scratch. What they chose tells you what money really is.
The Freddo was 10p for thirteen years. Cadbury itself now charges 45p, and cocoa only explains about 3p of the journey. A chocolate frog's guide to where your money went.

For thirty-eight years the ONS published what a pint cost, every month, in pence. The series stops in January 2025 at £4.83. Here is what replaced it, and why two official figures for the same pint are 41p apart.

22.7 million people hold Premium Bonds and nearly two-thirds have never won a penny. The advertised rate is an average that hides what most people actually get: nothing.